 Nadia Mohamed
Technical SEO
Core Web Vitals for Developers: How to Measure and Fix LCP, INP, and CLS in Code
I write code and I do SEO, and Core Web Vitals are the rare place where those two jobs speak the same language. Most performance advice aimed at developers stops at “improve your Core Web Vitals” and hands you a Lighthouse score. This guide does the opposite: it treats each metric as an engineering target with a threshold, a measurement source, and a diff you can ship. It’s a spoke in the SEO for engineers series — the stage where a page goes from crawlable to fast enough to rank.
Core Web Vitals are three field-measured metrics — Largest Contentful Paint, Interaction to Next Paint, and Cumulative Layout Shift — that quantify loading, responsiveness, and visual stability for real users. They’re a confirmed Google page-experience ranking signal, and unlike most of SEO, each one is an unambiguous number with a code-level fix.
Key takeaways
-
There are three metrics, and each maps to a phase of the experience. LCP measures loading, INP measures responsiveness, CLS measures visual stability. Per web.dev, the “good” thresholds are LCP under 2.5s, INP under 200ms, CLS under 0.1, evaluated at the 75th percentile of real page loads.
-
INP replaced First Input Delay on March 12, 2024. INP became a stable Core Web Vital that day; FID was removed from Search Console immediately, with a six-month deprecation elsewhere. If a guide still lists FID, it’s out of date.
-
Field data is what ranks you, not lab scores. Google’s page-experience signal draws on the Chrome UX Report (CrUX) — real-user data. A Lighthouse run on your fast laptop is a diagnostic, not the number Google sees.
-
Every metric has a code fix, not a config toggle. LCP is fixed with
fetchpriorityand preloads; CLS with intrinsic dimensions and reserved space; INP by shipping less JavaScript and yielding to the main thread. -
Fast, server-rendered HTML compounds into AI visibility. The same raw HTML that clears these metrics quickly is the HTML that AI crawlers — which don’t run JavaScript — can actually read and cite.
The three metrics and their current thresholds
Core Web Vitals are a subset of the broader Web Vitals program, chosen because they map cleanly onto how a user actually perceives a page: does it load, does it respond, does it hold still. Here’s what each one measures and where the line sits.
Largest Contentful Paint (LCP) — loading. LCP reports the render time of the largest image, text block, or video in the viewport, relative to when navigation started. It’s the closest single number to “when did the main content appear.” Good is 2.5 seconds or less; anything over 4.0s is poor.
Interaction to Next Paint (INP) — responsiveness. INP measures the latency of every click, tap, and key press across the whole visit — input delay, event handler work, and the time to paint the next frame — and reports a representative high value. Good is 200 milliseconds or less; 200–500ms needs improvement; over 500ms is poor. INP is the metric that replaced First Input Delay in March 2024, because FID only measured the delay before the first interaction and ignored everything after it.
Cumulative Layout Shift (CLS) — visual stability. CLS measures the largest burst of unexpected layout shift during the page’s lifecycle — the jump when an image loads without reserved space, or an ad pushes the article down as you start reading. Good is 0.1 or less; over 0.25 is poor.
How to measure: field data vs lab data
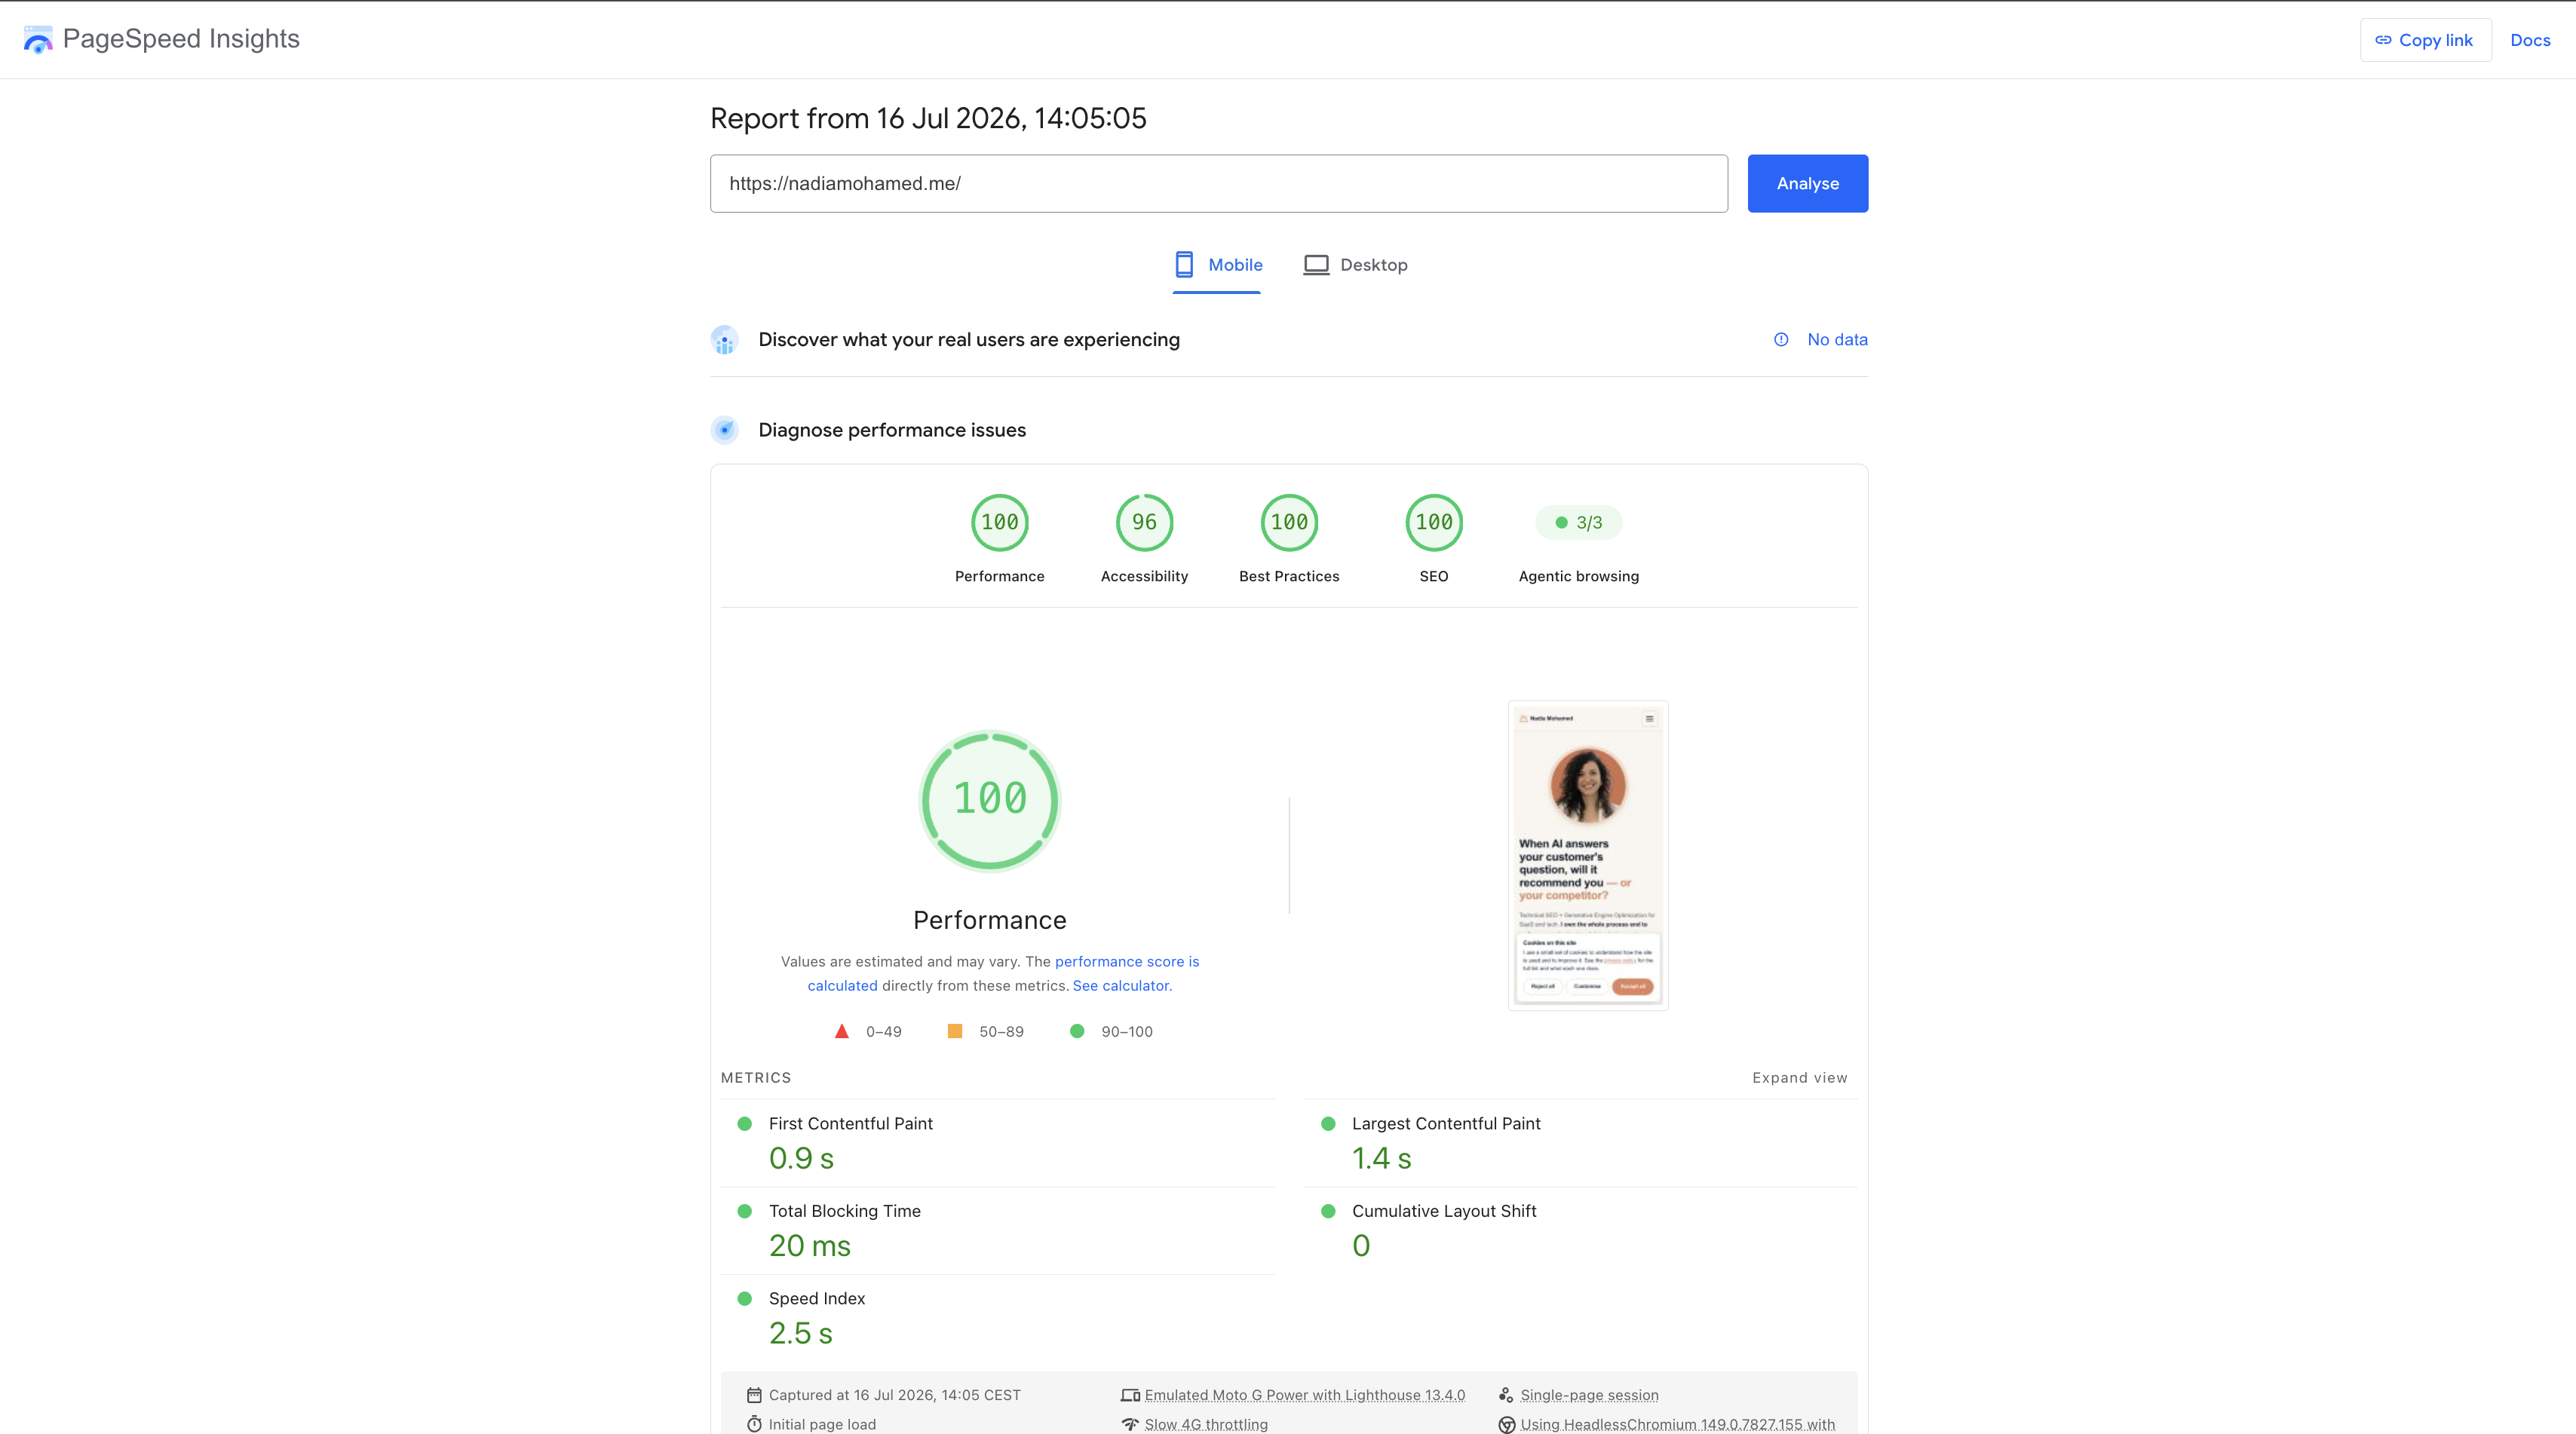
/assets/screenshots/core-web-vitals-for-developers/pagespeed-field-vs-lab.png This is the distinction that trips up most engineers, and getting it wrong means optimising for a number Google never sees.
Lab data comes from a synthetic run in a controlled environment — Lighthouse, the Performance panel in Chrome DevTools, or a CI check. It’s reproducible and it’s where you debug, because it gives you a waterfall and a call tree. But it’s one device, one network throttle, one moment. A lab LCP of 1.9s on your laptop tells you very little about a user on a mid-tier Android phone over spotty 4G.
Field data comes from real users. Google aggregates it in the Chrome UX Report (CrUX) — a 28-day rolling dataset of actual Chrome sessions — and CrUX is explicitly the source that feeds the page-experience ranking factor. This is the data that ranks you. It’s reported at the 75th percentile, so a long tail of slow sessions on cheap hardware pulls your score down even if your median is fine.
Where to look, in order of usefulness:
- PageSpeed Insights shows both at once: CrUX field data at the top (your real ranking-relevant numbers, if the URL has enough traffic to be in the dataset) and a Lighthouse lab run below it for diagnosis.
- Search Console → Core Web Vitals report groups your URLs into good / needs improvement / poor using field data — the fastest way to see which templates are failing at scale.
- Your own RUM. For pages without enough CrUX traffic, or to catch regressions before the 28-day window catches up, collect field data yourself with Google’s
web-vitalslibrary:
// Real-user monitoring in ~5 lines. Send these to your analytics
// endpoint and you have your own field data, per route, in real time.
import { onLCP, onINP, onCLS } from 'web-vitals';

onLCP(sendToAnalytics);
onINP(sendToAnalytics);
onCLS(sendToAnalytics);
Once you look after more than a handful of sites, running PageSpeed Insights by hand stops scaling. Apogee Watcher runs scheduled PSI tests across many URLs and pairs the lab results with CrUX field data where it’s available, so you get both views in one multi page report instead of checking each page yourself.
The rule I follow: debug in the lab, judge in the field. If Lighthouse says 100 and CrUX says you’re failing INP, CrUX wins — real users are hitting something your synthetic run didn’t.
What to fix first when all three are failing
Fix LCP first, then CLS, then INP — and fix the template rather than the page. LCP has the highest ceiling and the cheapest wins, CLS is usually a handful of missing dimensions, and INP is the one that turns into an architecture conversation. Working in that order means the expensive problem is the last one you reach, and you may find it fixed itself once the page ships less work.
A failing Core Web Vitals report is rarely one problem. It is usually a template with three symptoms, and the order you attack them in decides whether this takes an afternoon or a quarter.
1. LCP, because the wins are large and cheap. Most bad LCP scores come down to three things: the hero image is not preloaded, it is lazy-loaded when it should not be, or it is behind a render-blocking stylesheet or font. Each is a one-line change with a measurable effect, and LCP is usually the metric furthest from its threshold. Start here even if another metric looks worse, because the effort-to-improvement ratio is not close.
2. CLS, because it is nearly always the same bug. Layout shift is dominated by assets that arrive without reserved space — images without width and height, ads and embeds in unsized containers, and fonts that swap metrics mid-render. These are mechanical fixes with no architectural consequence, and the whole metric often resolves in one pass. It is also the metric users notice most viscerally, which makes it easy to justify.
3. INP last, because it is the one that is actually about your architecture. Interaction latency is a symptom of how much JavaScript runs on the main thread, and there is no fetchpriority equivalent that makes it go away. Fixing it properly means shipping less, breaking up long tasks, and sometimes reconsidering how much of the page needs to be interactive at all. Two things make it worth deferring: it is the most expensive to fix, and the work you do for LCP — deferring scripts, trimming bundles — frequently improves it as a side effect. Measure again after steps one and two before committing to an INP project.
Then: fix the template, not the URL. This is the single highest-leverage habit in performance work. Core Web Vitals problems are almost never confined to one page — they belong to the template that generated it. A missing width on the article hero is a missing width on every article. Group your failing URLs by template before you touch anything, fix one representative page, and confirm the fix propagates. Repairing pages one at a time on a site with a hundred articles is a hundred times the work for the same result, and it is how performance projects stall.
The same instinct applies elsewhere in technical SEO: Search Console reports with four-figure row counts are lists of symptoms, and the pattern behind them is the finding.
Fixing LCP: get the largest element painted sooner
The most common LCP failure I see is a hero image the browser discovers late — referenced deep in the component tree, lazy-loaded by a well-meaning default, and competing with render-blocking CSS. Three changes fix the majority of cases.
Preload it and mark it high priority. Tell the browser the LCP image matters before it finds it naturally:
<!-- Before: hero is discovered late, LCP drags -->
<img src="/hero.avif" alt="…" />

<!-- After: preload in <head>, and flag priority on the element -->
<link rel="preload" as="image" href="/hero.avif" fetchpriority="high" />
<img src="/hero.avif" alt="…" fetchpriority="high" decoding="async" />
Never lazy-load the LCP element. loading="lazy" on an above-the-fold hero is self-sabotage — it defers the one image you need first. Lazy-load everything below the fold and load the hero eagerly.
Cut the critical path. LCP can’t fire until the browser has parsed the render-blocking resources ahead of it, so defer non-critical scripts, inline only the CSS the first paint needs, and keep your Time to First Byte low with server-side rendering or a CDN cache. In a component framework, the highest-leverage audit is often what your layout drops into <head> on every single route.
Fixing INP: get off the main thread
INP regressions come from long JavaScript tasks blocking the main thread while the user is trying to interact. The browser can’t paint the response to a click until the thread is free, so the fix is structural: ship less JavaScript, and break up the work you can’t cut.
Yield to the main thread inside long tasks. If a handler does heavy work, chunk it and hand control back to the browser between chunks so it can paint:
// Before: one long task blocks paint until every item is processed
function process(items) {
  for (const item of items) doExpensiveWork(item);
}

// After: yield between chunks so the browser can respond to input
async function process(items) {
  for (const item of items) {
    doExpensiveWork(item);
    // scheduler.yield() where supported; setTimeout is the fallback
    await new Promise((r) => setTimeout(r));
  }
}
Defer non-critical work. Analytics, third-party widgets, and anything not needed for the first interaction should load with defer, behind requestIdleCallback, or on interaction — not in the initial execution burst.
Attack hydration cost. On component-framework sites the biggest single INP win is usually the framework itself: a page that hydrates the entire tree on load blocks interaction far longer than one that hydrates only the interactive islands. This is exactly why render strategy — the subject of the SEO for engineers hub — has direct INP consequences, not just crawlability ones.
Fixing CLS: reserve the space before the asset arrives
Layout shift is almost always an element that loads without the browser knowing how much room to leave for it. The fixes are all about reserving space up front.
Always ship intrinsic dimensions. Give images and videos width and height (or a CSS aspect-ratio) so the browser reserves the box before the file arrives:
<!-- Before: image loads, everything below it jumps down -->
<img src="/diagram.avif" alt="…" />

<!-- After: the browser reserves the box up front, zero shift -->
<img src="/diagram.avif" alt="…" width="1200" height="675" />
Reserve space for anything that arrives late. Ad slots, embeds, and cookie banners are classic CLS offenders — give them a min-height container so their arrival doesn’t reflow the content around them. The banner case is common enough that I’ve written up how to build a cookie banner that doesn’t shift the layout separately.
Handle web fonts. A font swapping in at a different size nudges the layout; font-display: optional or preloading the font with <link rel="preload" as="font"> keeps the text from reflowing once it loads.
Animate transforms, not layout. Animate transform and opacity, which the compositor handles off the main thread, rather than top, height, or margin, which trigger layout and can register as shift.
Why this compounds into AI visibility
There’s a bonus that most performance guides miss. The work you do to clear these metrics — server-rendering primary content, keeping it in the initial HTML, cutting the JavaScript on the critical path — produces exactly the kind of page that AI crawlers can read.
GPTBot, ClaudeBot, and PerplexityBot fetch raw HTML and parse it as text; they don’t run a headless browser or wait for hydration the way Googlebot eventually does. So a page whose content is server-rendered for a fast LCP is also a page those crawlers see in full, while a client-rendered page that scores badly on LCP is often the same one that’s effectively blank to them. The mechanics of that overlap — and how to check it with a single curl -A "GPTBot" — are in the JavaScript SEO guide. The short version: fast and crawlable are the same engineering work pointed at two audiences.
Where this fits
Core Web Vitals are one layer of a larger technical-SEO practice. If you want the standing-maintenance version — the crawl, index, rendering, and Core Web Vitals checks run on a cadence rather than once — that’s the technical SEO audit methodology. If you want the framework-specific render decisions that drive both LCP and INP, those live in the SEO for engineers hub. The through-line is the same: these are engineering problems with diffs, and the person who understands the render path is the one who should be fixing them.
FAQ
What are the three Core Web Vitals and their thresholds?
The three Core Web Vitals are Largest Contentful Paint (LCP, loading), Interaction to Next Paint (INP, responsiveness), and Cumulative Layout Shift (CLS, visual stability). Per web.dev, the “good” thresholds are LCP under 2.5 seconds, INP under 200 milliseconds, and CLS under 0.1, each measured at the 75th percentile of real page loads across mobile and desktop.
Did INP replace FID, and when?
Yes. Interaction to Next Paint officially became a Core Web Vital and replaced First Input Delay on March 12, 2024. FID was removed from Google Search Console immediately, while other tools like PageSpeed Insights and CrUX ran a six-month deprecation period. INP is a better responsiveness metric because it measures every interaction during a visit, whereas FID only measured the delay before the first one.
What’s the difference between field data and lab data for Core Web Vitals?
Lab data comes from a synthetic run in a controlled environment (Lighthouse, Chrome DevTools) and is where you debug. Field data comes from real users and is aggregated in the Chrome UX Report (CrUX), which is the dataset that feeds Google’s page-experience ranking factor. Field data is what actually affects rankings, so a good Lighthouse score doesn’t guarantee you’re passing — always judge with field data.
How do I measure my own Core Web Vitals?
Use PageSpeed Insights to see both CrUX field data and a Lighthouse lab run for a URL, and the Core Web Vitals report in Search Console to see which templates fail at scale. For pages without enough traffic to appear in CrUX, or to catch regressions early, collect your own real-user data with Google’s web-vitals JavaScript library (onLCP, onINP, onCLS) and send the values to your analytics.
How do you pass the Core Web Vitals assessment?
All three metrics have to be “good” at the same time, at the 75th percentile of real visits, segmented by mobile and desktop. Passing two and failing one is a fail. The thresholds are LCP under 2.5s, INP under 200ms, and CLS under 0.1, and because they are assessed at the 75th percentile rather than the median, you are clearing the bar for most users rather than the typical one — a long tail of slow sessions on cheap hardware will fail you even when your own device feels fast. Two practical consequences: judge yourself on field data rather than a Lighthouse run, and fix the template rather than individual URLs, since the assessment groups pages by similarity.
Are Core Web Vitals still relevant?
Yes, with the caveat that they were never the large ranking factor some coverage implied. Core Web Vitals are part of how Google evaluates page experience, and their honest value is as a tie-breaker among pages of comparable relevance rather than a way to outrank better content. That is not a reason to ignore them. The same work — smaller bundles, images that arrive when they should, layout that holds still — improves conversion, reduces bounce, and on a JavaScript-heavy site directly affects whether content reaches the crawler at all. Treat them as a proxy for build quality that happens to be measured publicly.
What’s the fastest fix for a bad LCP score?
Stop the largest element — usually the hero image — from being discovered late. Preload it with <link rel="preload" as="image" fetchpriority="high">, set fetchpriority="high" on the <img> itself, and make sure it is not lazy-loaded. Then reduce render-blocking CSS and JavaScript in the critical path so nothing delays the paint.
How do I fix Cumulative Layout Shift?
Reserve space for anything that loads after the initial render. Always set width and height (or aspect-ratio) on images and video, give ad slots and embeds a min-height container, handle web fonts with font-display: optional or preloading, and animate transform/opacity instead of layout-triggering properties like height or top.