 Nadia Mohamed
Measurement
SEO KPIs: How to Choose the Five That Actually Matter
Every guide to SEO KPIs hands you a list. Six of them, or nine, or forty-nine, arranged in descending order of how impressive they sound. The implication is that your problem is recall — that somewhere out there is a metric you have not heard of, and once you know its name your reporting will improve.
That is almost never the problem. If you run SEO for a mid-market company you already have more numbers than you can use. Search Console gives you four. GA4 gives you hundreds. Your rank tracker gives you one per keyword. The problem is not knowing what exists; it is deciding which four or five numbers belong in the report you send upstairs, and knowing which of them is quietly lying to you.
This guide is about that decision. By the end you will have a way to pick KPIs from your business model and your SEO maturity stage, a split between the indicators that move early and the ones that move late, a minimum observation window for each so you stop mistaking noise for trend, and a method for setting a target rather than watching a direction. It also treats AI search as a first-class measurement problem, because the surface that click-based KPIs measure is shrinking: SparkToro’s 2026 zero-click study found that 68.01% of US Google searches in the first four months of 2026 ended without a click, compared against the re-baselined 60.45% for 2024 rather than the older 58.5% figure.
Key takeaways
- SEO KPIs are numbers someone is accountable for; metrics are any numbers you can measure. Most SEO reports confuse the two.
- Choose KPIs from your business model and maturity stage first — five is the working ceiling for a reported set, not forty-nine.
- 68.01% of US Google searches ended without a click in early 2026, per SparkToro’s 2026 zero-click study — measured against SparkToro’s re-baselined 2024 figure — which breaks CTR and average position as top-line KPIs.
- Report leading and lagging indicators together: impressions and indexed coverage move months before revenue does.
- Every KPI needs a minimum trust window before a movement means anything — most SEO reporting cycles are shorter than the window.
What an SEO KPI Actually Is (and What It Isn’t)
A key performance indicator is a number tied to a business outcome that a named person is accountable for. That definition does most of the work, because it excludes almost everything in a standard SEO dashboard.
It helps to separate three things that get filed together. A metric is any number you can measure — sessions, impressions, crawl depth, referring domains. A KPI is the small subset of metrics that represent whether the work is succeeding in business terms. A diagnostic is a number whose only job is to explain why a KPI moved; it is genuinely useful and it is never a goal.
Average position is the clearest example of a diagnostic that gets misfiled as a KPI. Google’s own Search Console documentation defines it as the average position of the topmost result from your site — so if one query returns your pages at positions 2, 4 and 6, only the 2 is counted. Your average position therefore moves whenever the shape of your indexed footprint changes, entirely independently of performance. Publish thirty new pages that rank at position 40, and the number gets worse while nothing about your existing rankings changed.
That is not a KPI. It is a diagnostic that tells you where to look, and reporting it as a headline number means committing to explain, every quarter, a figure that moves for reasons unrelated to the work.
The three-question test
Before a number goes in the report, put it through three questions.
Does it connect to revenue, or to a defensible proxy for revenue? Can one person be held accountable for it? And would you change what you do next quarter if it moved by 20% in either direction?
Three yeses and it is a KPI. Anything less and it is a metric — keep it on the dashboard, keep it out of the report. Most SEO reports get shorter and considerably more useful the first time somebody applies this honestly.
Choose Your KPIs Before You Learn the List
Choosing SEO KPIs is driven by two variables: what your business sells, and how mature your SEO programme is. Get those right and the list picks itself.
Start with the business model. The primary KPI is the one number that, if it moves, tells you the programme is working. The supporting KPIs explain it. And there is usually one popular metric you should deliberately refuse to report, because in your model it is actively misleading.
| Business model | Primary KPI | Supporting KPIs | Deliberately ignore |
|---|---|---|---|
| Ecommerce | Organic revenue | Non-branded organic clicks, organic conversion rate, revenue per session | Average position — assortment size dominates it |
| SaaS | Organic-sourced trials or demos | Non-branded clicks to product and comparison pages, trial-to-paid rate by source | Total organic traffic — documentation traffic inflates it |
| Lead generation | Cost per qualified lead from organic | Qualified lead volume, form completion rate, lead-to-opportunity rate | Raw form fills — unqualified leads look like success |
| Publisher | Organic revenue per thousand sessions | Non-branded clicks, returning-visitor share, indexed article coverage | Bounce rate — a satisfied reader on a single article bounces |
| Local services | Organic-attributed calls and bookings | Non-branded local clicks, direction requests, conversion by location page | National keyword rankings — irrelevant outside your service radius |
Now adjust for maturity, because the same business at different stages cannot honestly report the same KPIs.
Months 0 to 3. You do not have enough conversion data to report a conversion KPI without misleading someone. Twelve organic leads becoming eighteen is not a 50% improvement; it is noise wearing a percentage sign. At this stage the honest KPIs are indexed coverage and impression growth — evidence that the work is entering the index and being seen. Say plainly in the report that revenue KPIs are not yet reportable, and when they will be.
Months 3 to 12. Non-branded clicks and organic conversions become reportable. Keep indexed coverage as a leading indicator. This is the stage where the leading-versus-lagging split matters most, because the lagging numbers are still thin while the leading ones are moving well.
Months 12 and beyond. Revenue and cost per acquisition carry the report. Coverage and impressions drop to diagnostics — still tracked, no longer headline.
One more constraint: five is the working ceiling. A set of five KPIs can be held in a stakeholder’s head and argued about in a meeting. Twelve cannot, and a set of twelve reliably contains at least three moving in opposite directions, which lets anyone construct whichever narrative they prefer. If you have more than five, you have built a dashboard and called it a report.
Selectivity is not a cosmetic concern. According to Jeff Coyle of MarketMuse, writing in Search Engine Journal, who estimates from his own client base, average content teams see around 10% of their content achieve its intended goals, while the strongest teams he works with reach 40% or more. That is his practitioner estimate rather than a study, but the direction is instructive: a fourfold difference in content efficiency between teams is not going to show up in a report tracking forty-nine numbers with no hierarchy.
Leading and Lagging Indicators: Report Both or Fly Blind
SEO KPIs move in sequence, not together, and a report that ignores the sequence will misread its own results for two quarters.
The chain runs like this. Pages get published, then indexed. Indexed pages accumulate impressions. Some impressions become clicks. Some clicks become conversions. Some conversions become revenue. Each link takes time, so the numbers at the front of the chain move months before the numbers at the end.
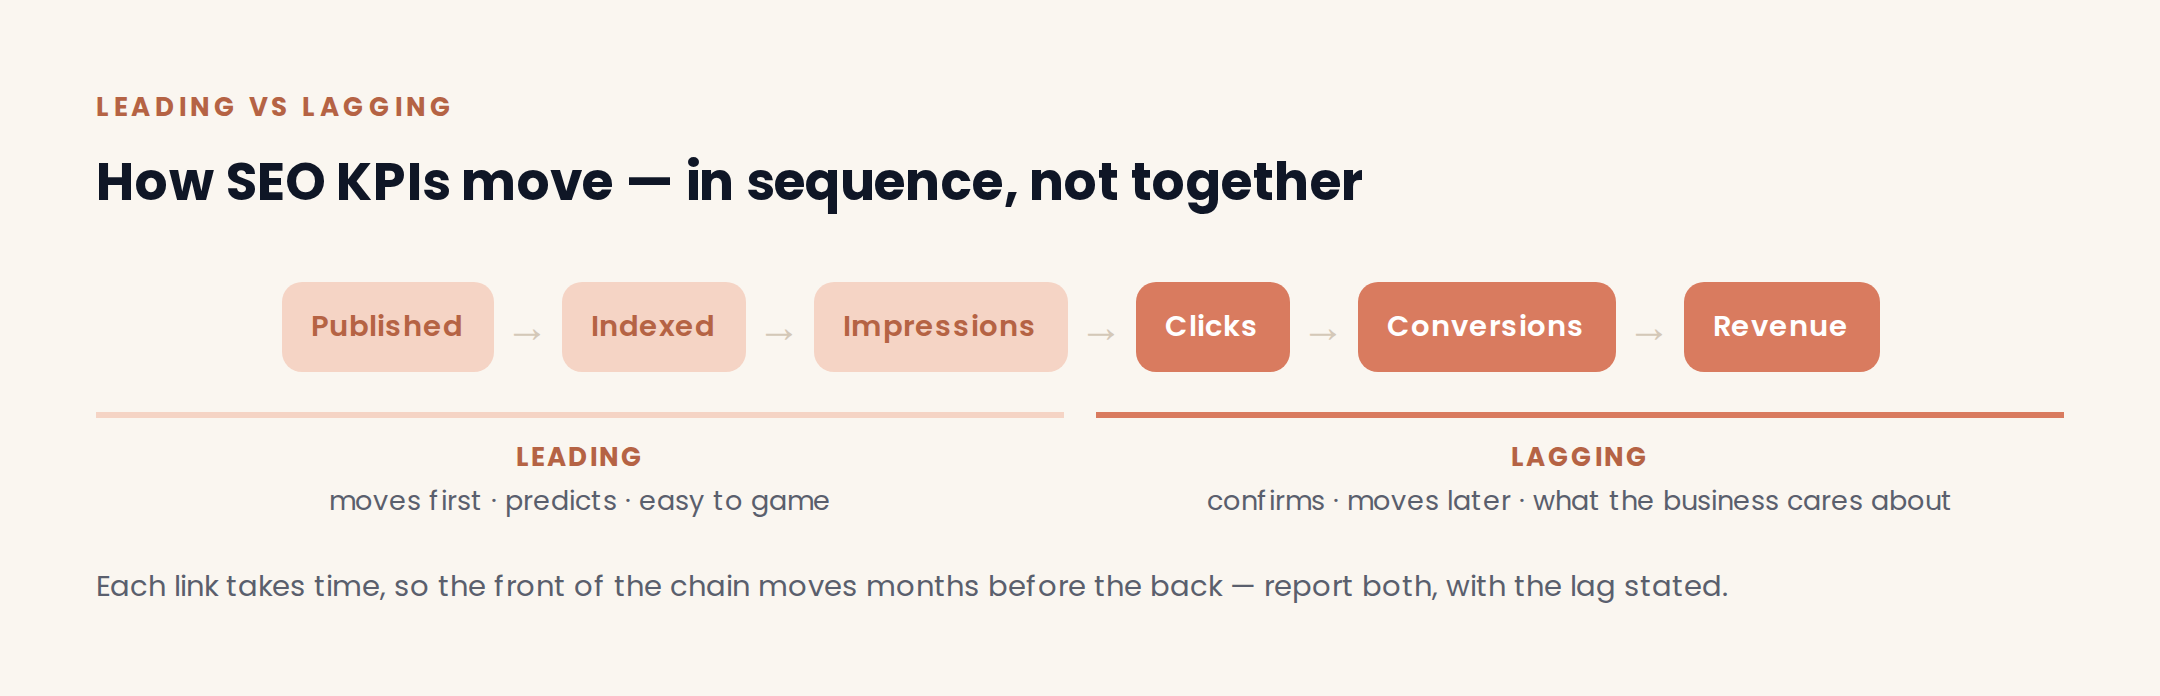
/assets/diagrams/leading-vs-lagging-kpi-chain.png Leading indicators sit at the front: indexed coverage, impression growth, keyword footprint (the count of distinct queries you appear for), and citation share in AI answers. They move first and they predict. They are also trivial to game, which is why they cannot stand alone.
Lagging indicators sit at the back: organic conversions, revenue, cost per acquisition. They are what the business actually cares about, and they confirm rather than predict. By the time they move, the work that caused it happened a quarter or two ago.
Report only lagging KPIs and every quarter becomes an argument about work you finished long ago. Report only leading KPIs and you have made your programme unfalsifiable — impressions can rise indefinitely while revenue does nothing, and nobody can prove you wrong. Both, side by side, with the lag stated explicitly.
This is also the honest answer to why SEO reporting so often looks like failure in Q1 and success in Q3 for the same body of work. Nothing changed except which part of the chain had caught up. If you want a leading signal specifically for AI-search readiness, an AEO scoring approach gives you something to track before citations start appearing.
The SEO KPIs Worth Reporting, and How to Track Each One
Here is the shortlist of SEO KPIs worth a place in the report, with what each one measures, where the number comes from, and the trap that makes it lie.
Take the sourcing seriously. Report from Search Console and GA4 wherever possible, because those are numbers your stakeholders can independently verify and reconcile. Third-party tools estimate traffic and visibility using their own models, and two vendors will give you two different figures for the same site with no way to settle which is right. That is a poor foundation for a KPI somebody is accountable for. Search Console is also the common denominator in practice — nearly 80% of the marketers in Databox’s tooling survey use it, a figure drawn from Databox’s survey of 129 marketers.
Organic conversions and organic revenue
What it measures: completed key events or revenue from sessions whose source is organic search. Where it comes from: GA4, key events filtered to organic session source. Type: lagging.
This is the only KPI that is never wrong to report. The trap is attribution windows — last-click attribution systematically understates SEO, because organic search frequently opens the relationship and something else closes it. Pick an attribution model, state which one you used in the report, and do not change it mid-year.
Non-branded organic clicks
What it measures: clicks from queries that do not contain your brand name. Where it comes from: Search Console, query filter excluding brand terms (Google’s own AI-classified split is also a card in Search Console Insights). Type: lagging, moving to leading at scale.
Total organic traffic is the most-reported and least-useful number in SEO, because branded search is demand you did not create. Run a television campaign and organic traffic rises without a single SEO improvement. Separating branded from non-branded is the single highest-value change most teams can make to their reporting.
Keyword footprint and share of visible search
What it measures: the count of distinct queries generating impressions for your site, and how that count is trending. Where it comes from: Search Console, queries with at least one impression. Type: leading.
Footprint is a better visibility KPI than the rank of any individual term, because it is robust to the SERP volatility that makes single-keyword tracking so noisy. The trap is counting queries with one impression a month as coverage — set an impression floor before you count.
Indexed coverage
What it measures: the proportion of your published pages that are indexed and receiving impressions. Where it comes from: Search Console Pages report, cross-referenced against your own published count. Type: leading, earliest in the chain.
This is the first place a problem shows up and the first place progress shows. A page that is not indexed cannot rank, cannot convert, and cannot be cited. Track published-versus-indexed as a ratio and investigate whenever the gap widens.
SEO ROI and cost per acquisition
What it measures: return relative to what the programme costs. Where it comes from: GA4 revenue or lead value, combined with your actual cost base. Type: lagging.
The formula is straightforward:
SEO ROI = (organic revenue − SEO cost) ÷ SEO cost
The discipline is entirely in the cost side. Include the retainer or salaries, tooling, developer hours spent on SEO work, and content production. Teams that report flattering ROI figures have usually counted the retainer and nothing else. For lead generation businesses, cost per acquisition is the more useful expression of the same idea, and it is the number that survives a budget review, because it can be compared directly against paid channels.
Once you know which five numbers belong in the report, the mechanics of assembling it become a build problem — which is what a Looker Studio SEO dashboard is for. Choosing the KPIs comes first; the dashboard is downstream of the decision, not a substitute for it.
AI Search KPIs: What You Can Measure and What You Can’t
AI search needs its own SEO KPIs, and it needs them handled with more honesty than the topic usually receives.
Four candidates are worth considering. AI feature impressions — how often your pages appear inside AI Overviews and AI Mode. Citation share — how often assistants link to you when answering questions in your category. AI referral sessions — actual visits arriving from assistant platforms. Citation durability — whether a citation you earned is still there in three months.
Start with Google’s own reporting, because it is the only vendor-neutral source. Search Console’s generative AI performance report covers impressions from generative AI features in Search, broken down by Pages, Countries, Dates and Devices. Note what is not in that list: clicks, click-through rate and query-level data are not among the documented metrics, so you can see that you appeared without seeing what was asked or whether anyone came through. Google’s Search Central announcement also notes the reports are rolling out to a subset of sites first, so check whether yours has them before promising the number to a stakeholder.
Size AI referral traffic honestly. Ahrefs’ analysis of nearly 76,000 sites found ChatGPT, the biggest chatbot traffic driver, sent only 0.21% of traffic, against almost 40% from Google. AI referral sessions are worth tracking as a directional signal, and reporting them as a volume story today is not defensible. If you do track them, the attribution mechanics for AI referral traffic need setting up properly first, or the number will be wrong in both directions. For citation share, checking manually whether your business appears in ChatGPT and Perplexity is a reasonable starting method, and citation decay is why durability deserves to be a KPI rather than a one-off check.
The impression-inflation trap
AI surfaces generate impressions that were never going to generate clicks. Your page appears inside an AI answer, the user reads the answer, the impression is counted and no click occurs.
The arithmetic consequence is that click-through rate falls while nothing about your page got worse. Impressions rise, clicks stay flat, CTR drops, and a stakeholder reads it as declining performance. This is why aggregate CTR has stopped functioning as a KPI, and why the zero-click dynamic matters for measurement rather than only for strategy — US zero-click searches went from 60.45% in 2024 to 68.01% in early 2026, according to SparkToro’s year-over-year comparison.
Report non-branded clicks in absolute terms instead, and use CTR only at the level of individual query-page pairs where you are actually testing a title change.
What is currently unmeasurable
Say this part out loud in the report, because the alternative is estimating and being wrong.
There is no clickstream for an assistant answer that never sends a session — if someone reads about you in ChatGPT and never clicks, no analytics property on earth records it. Referrer data from AI platforms is frequently stripped or misattributed to direct traffic. And no vendor can give you a defensible denominator for AI share of voice, because nobody knows the true population of prompts in your category; every share-of-voice figure is a share of that vendor’s prompt sample, not of reality.
A report that states these limits is more credible than one that fills the gap with a confident estimate. If a number does not exist, the honest line is that it does not exist yet.
How Long Before a KPI Means Anything — and How to Set a Target
Two problems get skipped in almost every guide to SEO KPIs: how long to wait before believing a movement, and how to set a target rather than admiring a direction.
Every KPI has a minimum trust window, and the noisier the metric, the longer the window. Reporting inside the window is how a two-week wobble becomes a strategy meeting.
| KPI | Minimum trust window | Seasonality trap |
|---|---|---|
| Indexed coverage | 2 to 4 weeks | Crawl scheduling clusters; check against publish dates, not calendar weeks |
| Impressions | 4 to 8 weeks | Query demand is seasonal; compare year-over-year, never month-over-month |
| Non-branded clicks | 8 to 12 weeks | Branded campaigns bleed into non-branded volume; check for overlapping activity |
| Organic conversions | 1 to 2 full quarters | Buying cycles compress in Q4 and stall in August |
| Organic revenue | 2 quarters minimum | Price and promotion changes move this more than SEO does |
| AI feature impressions | Insufficient history to state a window | Reporting changes and staged rollouts are indistinguishable from performance changes |
Two rules follow. Compare year-over-year for anything seasonal, because month-over-month comparison in a seasonal business measures the calendar. And when a KPI moves inside its trust window, name it as noise in the report rather than explaining it — teams that explain noise end up managing it.
There is a related habit worth borrowing from good research: state the basis of your numbers, not only the numbers. SparkToro’s stated methodology specifies a Similarweb desktop and mobile web panel for January to April 2026 in the US, and notes the data excludes searches inside the Google mobile app. That single sentence tells you exactly what the figure covers. Your KPI definitions deserve the same treatment — which property, which filter, which attribution model — because an undefined KPI gets silently redefined the moment it becomes inconvenient.
Then set the target by working backwards, not forwards.
Start with the revenue goal. Divide by average order value or average deal size to get the conversions you need. Divide by your current organic conversion rate to get the sessions required. Divide by a realistic click share for your query set to get the impressions you must earn. Now compare that impression requirement against the total search volume available in your market.
That last comparison is where the method pays for itself. Reasonably often the arithmetic shows the goal was never achievable — the target would require more clicks than the category generates. Better to establish that in a planning meeting, before the SEO roadmap is set, than to discover it in month nine. And once the chain is written down, every KPI has a parent, so anyone can trace how impression growth is supposed to become revenue.
The KPIs That Make Reports Look Good and Businesses Get Nothing
Some numbers survive in reports because they are flattering, not because they are informative. Each of these has a better replacement.
Average position across all keywords. As established earlier, this reports only your topmost result per query, so it moves whenever your indexed footprint changes shape. Publishing more pages can make it worse. Report movement for a defined set of priority queries instead.
Total organic traffic including branded. Rises when marketing runs a campaign, falls when the campaign stops, and tells you very little about SEO in either case. Report non-branded clicks.
Bounce rate as a quality signal. Google Analytics’ own definition makes bounce rate the inverse of engagement rate — the percentage of sessions that were not engaged, where an engaged session is one lasting longer than ten seconds, containing a key event, or containing two or more page views. So a reader who lands on your page, gets a complete answer in eight seconds and leaves satisfied is counted identically to a reader who bounced in disgust. A metric that cannot distinguish those two cases is not a quality signal. Report scroll depth or key events on the pages where reader behaviour genuinely matters.
Domain Rating, Authority Score and similar third-party numbers. These are vendor models built to compare sites, and no search engine uses them as a ranking input. They are legitimate competitive research and they are not performance indicators. Report referring domains from relevant sites if link acquisition is part of the programme.
Raw keyword counts. “We now rank for 14,000 keywords” is a number that grows on its own as a site ages, largely from long-tail terms with no volume. Apply an impression floor and report footprint growth within it.
Circulated benchmark figures. This one deserves naming directly. Numbers like a 40% bounce rate target, 70% scroll depth, one-minute dwell time or a 20%-plus page-one click-through rate get repeated across SEO blogs until they sound like industry standards. Trace them and they are usually individual practitioners’ opinions collected in survey roundups, with no study behind them. Putting an unsourced benchmark in a client report is how measurement loses its credibility, because the one stakeholder who checks will find nothing underneath it. Benchmark against your own trailing twelve months. That comparison is always available, always relevant to your market, and always defensible.
Frequently Asked Questions
What are KPIs in SEO?
SEO KPIs are the small set of numbers tied to business outcomes that show whether organic search work is succeeding — typically organic conversions, organic revenue, non-branded clicks, keyword footprint and indexed coverage. They differ from SEO metrics, which include every number you can measure. A KPI has someone accountable for it; a metric does not.
What is a bounce rate in SEO KPI?
Bounce rate is the percentage of sessions that were not engaged. Google Analytics’ own definition counts a session as engaged if it lasts longer than ten seconds, includes a key event, or includes two or more page views. It makes a poor SEO KPI because a visitor who finds a fast, complete answer and leaves is counted the same as one who left unsatisfied.
What are KPIs in Google Analytics?
In GA4, the numbers that qualify as KPIs are key events and revenue segmented by organic session source — the conversions and money attributable to search. Engagement rate, session duration and pages per session are diagnostics: useful for explaining why a KPI moved, but not goals in themselves.
What are the 3 types of KPIs?
The distinction that matters for SEO is between metrics, KPIs and diagnostics. A metric is any measurable number. A KPI is a metric tied to a business outcome with a named owner. A diagnostic explains why a KPI moved but is never a target. Separately, KPIs split into leading indicators, which move early and predict, and lagging indicators, which confirm results after the fact.
How many KPIs should an SEO report have?
Five is the practical ceiling. A set of five can be held in a stakeholder’s head and argued about productively; beyond that, some will always be moving in opposite directions, which lets anyone assemble whichever story they prefer. Keep the remaining metrics on a dashboard for diagnosis and out of the report.