 Nadia Mohamed
Measurement
How to Build an SEO Reporting Dashboard in Looker Studio
What is an SEO reporting dashboard in Looker Studio?
An SEO reporting dashboard in Looker Studio is a single report that pulls your Google Search Console and Google Analytics 4 data into one place, so clicks, impressions, position, and landing-page performance live on one screen instead of three browser tabs. Looker Studio is a no-cost tool that turns your data into shareable, customizable dashboards and reports, and it connects to both Search Console and Analytics natively — no code, no export-to-spreadsheet ritual. The build is mostly plumbing: connect the right data sources, put the four or five reports that actually move decisions on the page, and share it so stakeholders stop asking you for numbers.
I build the site and I do the measurement, so I’ve assembled this dashboard more times than I can count — for my own projects and for clients who were living inside the Search Console UI one query at a time. The tool is genuinely good and genuinely free. The hard part isn’t the software; it’s resisting the urge to put everything on the page. This guide is the opinionated version: the exact connectors to use, the handful of reports worth building, where the data will quietly mislead you, and how to share the result.
One housekeeping note before you open the product. In April 2026, Google returned Looker Studio to its original name, Data Studio, and the URL is now datastudio.google.com (the old lookerstudio.google.com redirects). Everything below is the same product most people still search for as “Looker Studio” — the UI you’ll see just says Data Studio now.
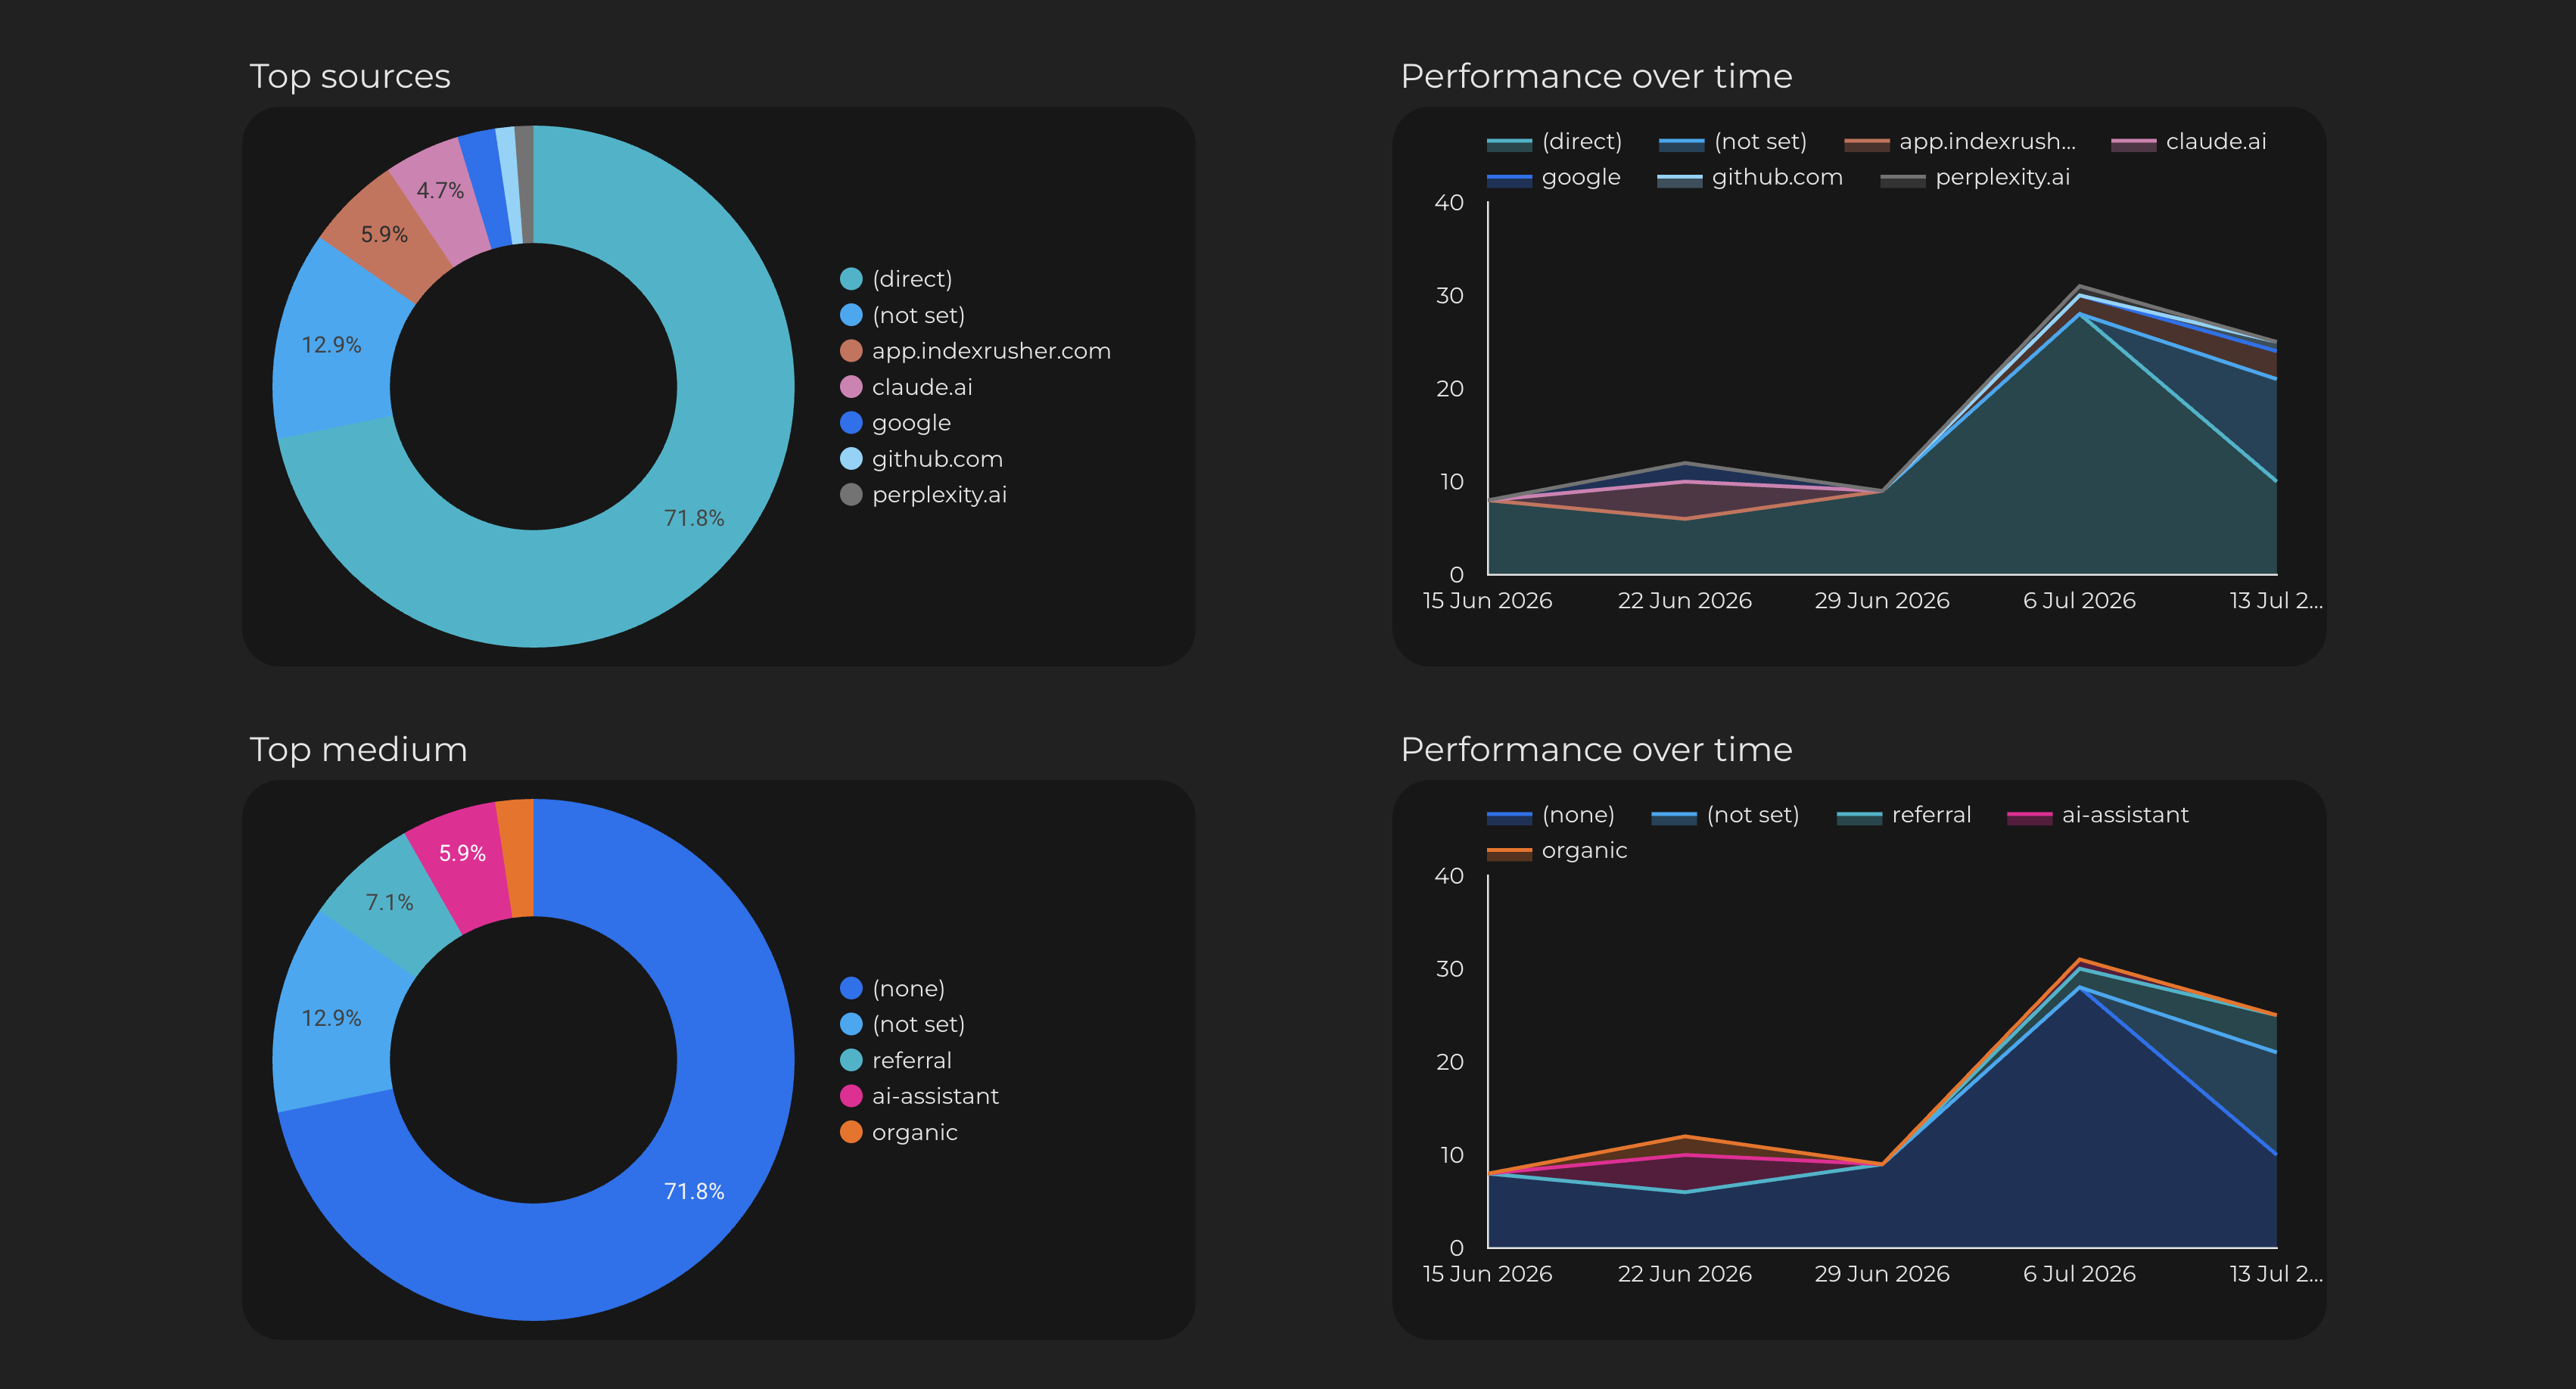
/assets/screenshots/looker-studio-seo-dashboard.png TL;DR — what to build
-
Two data sources carry the whole dashboard: Search Console and GA4. Search Console tells you how you appear in Google (clicks, impressions, position, queries); GA4 tells you what visitors do after they land. The Search Console connector and the Google Analytics connector are both built in.
-
The Search Console connector makes you pick Site Impression or URL Impression per data source — not both. A single Search Console data source can only use one of these aggregation methods. To show both side by side, you add the connector twice.
-
The GA4 connector only speaks GA4. The Google Analytics connector supports Google Analytics 4 properties, and you need at least Read & Analyze permission on the property.
-
Report the four metrics Search Console actually defines — clicks, impressions, CTR, average position — and the six dimensions it groups by. Those are queries, pages, countries, devices, search appearance, and dates. Everything else is decoration.
-
Blend sources sparingly. You can blend up to five data sources, but each blend adds a place for the numbers to go subtly wrong. Blend Search Console and GA4 on the page/landing-page key only when a chart genuinely needs both.
-
Share it like a Google Doc. Invite people or groups, or turn on link sharing; schedule a PDF; embed it. A finished, shared dashboard is the thing that ends the “can you send me the numbers” emails — the same reason full-funnel tracking exists.
The two data sources that matter
A useful SEO dashboard is a two-source story. Search Console is the only place with your real Google Search impressions, positions, and the queries people used; GA4 is the only place with on-site behaviour and conversions. Build both connections first, then chart on top of them.
Connect Search Console
The Search Console connector is the foundation. The steps Google documents:
- Sign in to Data Studio, and in the top left click Create → Data Source.
- Select the Search Console connector.
- Click AUTHORIZE if prompted.
- In the Sites panel, choose the property to connect. (If you don’t see a property you own, make sure you’re signed in to Data Studio and Search Console with the same Google Account and have at least view permission on the property.)
- In the Tables panel, choose either Site Impression or URL Impression.
- Choose a default Search Type, then click CONNECT.
Step 5 is the one people miss. Search Console uses two different aggregation methods, and a single data source can only use one of them. Site Impression counts an impression once per query when your site appears — good for high-level clicks/impressions/CTR trends. URL Impression aggregates by page and unlocks page-level analysis plus extra search types like discover and googleNews. If you want both views on the same dashboard, create two Search Console data sources and add both to one report — that’s the supported pattern, not a workaround.
Connect GA4
The Google Analytics connector is the second source. Same shape: Create → Data Source → Google Analytics → AUTHORIZE, then select an account and a GA4 property and click CONNECT. Two things worth knowing before you rely on it:
- It’s GA4 only. The connector supports Google Analytics 4 properties, and you need at least Read & Analyze permission on the property. If you’re staring at an empty picker, it’s almost always a permissions problem, not a connector one.
- It mirrors GA4 reports, not Explorations. Data Studio matches the data in Google Analytics reporting, but not the Explorations, and GA4 segments and comparisons aren’t available through the connector. Reports built on it are also subject to the GA4 Data API quotas — a very active report on a large property can hit them and show an error.
The reports that actually matter
Here’s where restraint pays off. Search Console exposes exactly four metrics — Clicks, Impressions, CTR, and Average position — and groups them by six dimensions: Queries, Pages, Countries, Devices, Search appearance, and Dates. A dashboard that reports those cleanly beats one that reports thirty things badly. My default page:
- A summary row of the four headline numbers. Clicks, impressions, CTR, and average position as single-value tiles across the top. Average position is the average position of the topmost result from your site — treat it as a directional trend, not a precise rank.
- A clicks-and-impressions trend over time. A time-series chart on the Dates dimension. This is the “are we growing” chart executives actually read.
- Top queries. A table grouped by the Queries dimension, sorted by clicks, with impressions, CTR, and position alongside. This is your “what are we winning and where are we stuck on page two” view.
- Top pages. A table grouped by Pages (this needs a URL Impression source). Cross-reference it against your commercial pages, not just your blog.
- A GA4 behaviour panel. Landing-page engagement and conversions from the GA4 source, so the dashboard answers “did that Search traffic do anything,” not just “did it arrive.”
Two data honesty points to bake in, because they will bite you otherwise:
Search queries are deliberately incomplete. To protect user privacy, Search Analytics doesn’t show all data — Google may withhold queries made a small number of times or that contain personal or sensitive information, and those get aggregated into a single blank-value row. Your query table will never sum to your total clicks, and that’s expected. You can filter the Query dimension to exclude null values so the blank row stops distracting people.
The most recent days are provisional. In Search Console, the newest data can be preliminary — still being collected and liable to change in the next few hours. When yesterday looks like a cliff, it’s usually preliminary data, not a traffic collapse. Set your default date range back a few days from “today” and you’ll stop fielding false alarms.
One more that explains most “the totals don’t match” tickets: in Search Console, chart data is aggregated by property while table data grouped by Pages or Search appearance is aggregated by page, so chart totals and table totals legitimately differ. Note it once on the dashboard and move on.
Blend Search Console and GA4 — sparingly
The tempting move is to blend Search Console and GA4 into one table so you can see impressions, clicks, and on-site conversions in a single row keyed by page. You can: Data Studio lets you blend data from up to five data sources without writing SQL, using a visual join editor. For an SEO dashboard, you’d join the Search Console URL Impression page field to the GA4 landing-page field.
Know how the join behaves before you trust the output:
- Pick the operator deliberately. Data Studio supports inner, left outer, right outer, full outer, and cross joins. For “Search Console pages, enriched with GA4 where it exists,” a left outer join from the Search Console table is usually what you want.
- Joins are equality-only. Data Studio only supports equality between the fields in a join condition — the page path in Search Console has to match the landing-page value in GA4 exactly, and trailing slashes or query strings will quietly break rows.
- Rows can collapse. Before joining, Data Studio groups and aggregates each table by its dimensions, which can collapse identical rows and produce a lower row count than a raw SQL join. Add a unique identifier to each table if the counts look short.
- Blends live inside one report. Blends are always embedded in the report where they’re created and can’t be made reusable, so if you rebuild the dashboard elsewhere, you rebuild the blend.
My rule: blend only for the one or two charts that genuinely need both sources in the same row. For everything else, put a Search Console chart and a GA4 chart next to each other on the page. Two honest charts beat one fragile blend.
Share the dashboard
A dashboard nobody can open is a private hobby. Looker Studio shares like the rest of Google’s suite. You can invite specific people or Google Groups, or turn on link sharing so anyone with the link can view. The mechanics that matter:
- View vs edit. Assign Can view or Can edit per person or group. No login is required to view a report shared by public link, but a Google login is required to view or edit a report shared to a specific email or group.
- You must be an owner or editor to share it, and you can share with up to 1,500 principals (individual addresses plus Google Groups).
- Automate the boring part. Instead of screenshotting monthly, schedule a PDF of the report to send to stakeholders on a recurring basis.
- Embed it where people already look. You can embed the report in Google Sites or any iframe-enabled page — an internal wiki or client portal beats a link buried in an inbox.
What I’d skip, and the mistakes I see most
- Don’t try to force Site and URL impressions into one data source. They’re two different aggregation methods and one data source uses one of them. Add the connector twice; label each source clearly.
- Don’t present the query table as complete. Anonymized low-volume and sensitive queries are withheld by design. If a stakeholder asks why queries don’t sum to clicks, that’s the answer.
- Don’t over-blend. Every blend is a join you now have to trust. Keep them to the charts that truly need both sources.
- Don’t alarm anyone with the most recent days. The newest data can be preliminary and change; trail your default range back from today.
If you want the same rigour applied to how AI assistants and Google’s AI surfaces send you traffic, that’s a related-but-separate measurement problem — I walk through the GA4 side of it in how to track AI referral traffic in GA4. And if the dashboard is exposing technical problems upstream — pages that don’t get impressions because they aren’t crawlable or structured well — that’s the GEO and technical SEO layer, not a reporting fix.
FAQ
Is Looker Studio free?
Yes. Looker Studio (now Data Studio) is a no-cost tool for building dashboards and reports. There’s a paid Data Studio Pro tier that adds enterprise collaboration and administration features, but the core product — including the Search Console and GA4 connectors used in this guide — costs nothing.
Is Looker Studio the same thing as Data Studio?
They’re the same product. In April 2026, Google returned the Looker Studio name to its original name, Data Studio, and moved it to datastudio.google.com (the old lookerstudio.google.com domain redirects). Most people still search for “Looker Studio,” but the UI you’ll open now says Data Studio.
Can I combine Search Console and GA4 in one report?
Yes, in two ways. The simple way is to add both connectors to the same report and place their charts side by side. The tighter way is to blend the two sources — joining Search Console pages to GA4 landing pages — so a single table shows impressions, clicks, and on-site behaviour together. Blend only when a chart genuinely needs both sources in one row.
Why don’t my Search Console numbers match between charts?
Usually because of aggregation. In Search Console, chart data is aggregated by property, while table data grouped by Pages or Search appearance is aggregated by page, so the totals differ legitimately. Separately, the most recent data can be preliminary and change within hours, and anonymized queries are withheld — both mean the pieces won’t always sum to the whole.
What’s the difference between Site Impression and URL Impression?
They’re the two aggregation methods the Search Console connector exposes. Site Impression counts impressions at the property level and is best for headline clicks/impressions/CTR trends. URL Impression aggregates by page — required for page-level tables — and supports additional search types including discover and googleNews. A single data source uses one method, so add the connector twice if you need both.
How many data sources can I blend in one chart?
Up to five. A blend can contain up to five tables, joined with inner, left outer, right outer, full outer, or cross joins, using equality conditions. For an SEO dashboard you rarely need more than two — Search Console and GA4.