 Nadia Mohamed
AI-SEO & GEO
AI Brand Visibility: How to Measure It, What Moves It, and What to Report
AI brand visibility is how often AI answer engines such as ChatGPT, Gemini, Perplexity and Google’s AI Overviews name your brand, cite your pages and describe you accurately when people ask about your category. It is not one number. It is a small stack of rates measured over a sample of answers, and the sample decides what you are allowed to claim.
This article defines that stack, explains why a single run of a prompt tells you almost nothing, sets out what the evidence says moves visibility (and how weak that evidence is), and ends with a monthly reporting template you can copy. Tools get one short section, because they are compared properly elsewhere on this site.
Key takeaways
- Measure AI brand visibility as four separate metrics: mention rate, citation share, share of voice and framing. A blended “visibility score” hides which one moved.
- The unit is one response. Every metric is a rate over responses, reported per engine, never pooled across engines.
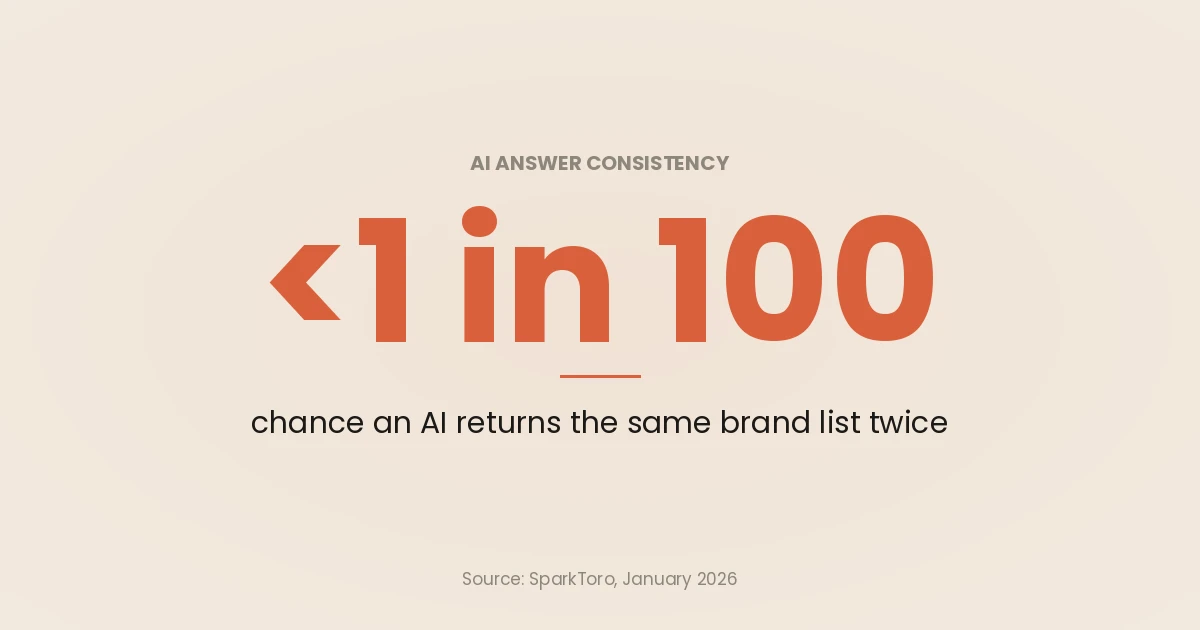
- AI answers are close to random at the level of a single list. In SparkToro’s research, there was less than a 1 in 100 chance that ChatGPT or Google’s AI would give the same list of brands twice in 100 runs of a prompt, so rank position in an answer is not a usable metric. Visibility rates across many runs are.
- The strongest correlates of AI visibility are off-site: brand mentions across the web and on YouTube. They are correlations, not proven causes, so treat them as a direction for work, not a forecast.
- A report is only honest if it carries the sample size and the interval beside every rate, and says “no detectable change” when the change sits inside the noise.
What AI brand visibility is, and what it is not
Ask what AI visibility is and most definitions stop at “whether your brand shows up in AI answers”. That is the right idea and the wrong level of detail, because “shows up” covers at least four different things: being named, being cited as a source, being named more often than competitors, and being described correctly.
It helps to be clear about what AI brand visibility is not:
- It is not a ranking. There is no stable position one to ten inside a generated answer. The order changes from run to run, which the sampling section below shows in detail.
- It is not traffic. A brand can be named in most answers in its category and receive very few clicks from them. Visits and conversions from assistants are a separate measurement, covered in tracking AI referral traffic in GA4 and attributing conversions from AI assistants.
- It is not your Search Console data. Google says in its guide to AI features that sites appearing in AI Overviews and AI Mode are included in the overall search traffic in Search Console, reported in the Performance report under the “Web” search type. That is useful for clicks, but it cannot tell you whether an AI Overview named your brand without linking to you.
So AI brand visibility is a sampled, per-engine measurement of what the engines say. It sits upstream of traffic, and it has to be collected by running prompts, not read from an analytics platform.
The metric stack: four rates and one unit
Fix the unit of analysis first. One response is one prompt, on one engine, from one location, at one time. Every metric below is a rate over responses. A brand named five times in one answer counts once, because the reader saw it once.
| Metric | How to calculate it | What it answers | How it misleads |
|---|---|---|---|
| Mention rate | Responses naming the brand ÷ all responses | Are we in the consideration set? | Inflated if prompts name the brand |
| Citation share | Responses citing a page on our domain ÷ all responses | Do the engines use our pages as evidence? | Volatile at small samples |
| Share of voice | Our mentions ÷ mentions of all tracked brands (each counted once per response) | Are we named more or less than competitors? | Moves when competitors move |
| Framing | Coded label per response, such as “budget option” or “enterprise” | How are we positioned when named? | Sentiment scores are almost always “neutral” |
Mention rate
Mention rate is the most robust number in the stack, because it does not depend on what any other brand did. If you only report one metric, report this one, per engine, with its interval.
Keep branded prompts out of the main sample. A prompt that names you (“Is Acme good for small teams?”) measures whether the engine can talk about you, not whether it chooses you. Track branded prompts separately, as an accuracy check.
Citation share
Citation share asks whether a page on your domain appears among the sources. It diverges from mention rate all the time. Engines often name a brand while citing a third-party review, a comparison post or a forum thread. That third-party layer is the actionable output, because those are the pages you can influence.
Citations are also far less stable than mentions. In the 32-response sample behind this site’s AI share of voice method, 79 of the 114 cited domains appeared exactly once. At small samples, treat citations as a list of examples, not a rate.
Share of voice
Share of voice is the competitive metric: your mentions divided by the mentions of every brand in a fixed set. The set has to be chosen before the first prompt runs. If the denominator is whatever brands a tool detected in the answers, it changes every month, and the ratio stops meaning anything. The full method, including aliases and scoring rules, is in AI share of voice: a repeatable method.
Never report share of voice without the mention rates beside it. A competitor dropping out of the answers raises your share even if nothing about your own visibility changed.
Framing, sentiment and accuracy
Most tools score sentiment. In practice, generated answers tend not to be negative about a brand they choose to name, so the score sits near neutral and never moves. A short categorical code is more useful: “enterprise”, “cheapest option”, “for existing users of X”, “outdated”. It tells you which box the engines have put you in.
Add an accuracy check for branded prompts: are the price, the product names and the claims in the answer correct? When they are wrong, the cause is usually a stale or wrong source page, and the fix starts with finding it. How often engines misreport figures, even when they link a source, is tested in the AI citation accuracy study.
Why not a single visibility score?
Many platforms roll mentions, citations, position and sentiment into one composite. It is convenient for a dashboard tile and useless for a decision, because you cannot tell which input moved, and nobody else’s score is comparable with yours. Keep the four rates separate and let the reader combine them.
Drop “average position” altogether. SparkToro’s conclusion, after nearly 3,000 runs, was that “any tool that gives a ‘ranking position in AI’ is full of baloney”, and their data backs it, as the next section shows.
The sampling problem
Generated answers are non-deterministic. Ask the same question twice and you get a different answer, so a single run describes one draw from a distribution, not your visibility.
The clearest public evidence is SparkToro’s January 2026 study, run with Patrick O’Donnell of Gumshoe.ai. 600 volunteers ran 12 recommendation prompts through ChatGPT, Claude and Google’s AI a combined 2,961 times in November and December 2025. The findings:
- There was less than a 1 in 100 chance that ChatGPT or Google’s AI, asked 100 times, would give the same list of brands in any two responses.
- The same list in the same order was closer to 1 in 1,000.
- The number of items per answer varied too, from two or three recommendations to ten or more.
The same study found the part that makes measurement possible. Across many runs, the brands that appear most often are fairly consistent. When volunteers wrote 142 different prompts with the same intent, choosing headphones for a travelling family member, the prompts barely resembled each other (an average semantic similarity of 0.081). Yet across the 994 responses those prompts produced, Bose, Sony, Sennheiser and Apple each appeared 55% to 77% of the time. SparkToro’s conclusion is that visibility percentage across dozens to hundreds of prompts, run multiple times, is a reasonable metric.
Two caveats belong next to those numbers. The authors say they are not professional researchers and call for far larger samples, and Gumshoe sells AI tracking, a possible conflict of interest the post discloses. Neither changes the practical rule: measure rates across many runs, never positions in one.
How many responses you need
A mention rate is a proportion, so its uncertainty follows from the sample size. The worst case is a brand named in half the answers. This is the 95% Wilson interval at a 50% rate:
| Responses per engine | 95% interval at a 50% rate | Width |
|---|---|---|
| 16 | 28% to 72% | 44 points |
| 50 | 37% to 63% | 27 points |
| 100 | 40% to 60% | 19 points |
| 200 | 43% to 57% | 14 points |
| 400 | 45% to 55% | 10 points |
The table comes from the snippet below, which you can drop into any notebook or scheduled script that scores your responses:
from math import sqrt

def wilson(hits, n, z=1.96):
    """95% Wilson score interval for a mention rate."""
    if n == 0:
        return (0.0, 0.0)
    p = hits / n
    denom = 1 + z**2 / n
    centre = (p + z**2 / (2 * n)) / denom
    half = z * sqrt(p * (1 - p) / n + z**2 / (4 * n**2)) / denom
    return (centre - half, centre + half)

for n in (16, 50, 100, 200, 400):
    lo, hi = wilson(n // 2, n)
    print(f"n={n:>3}  interval {lo:.0%} to {hi:.0%}  width {100*(hi-lo):.0f} points")
The consequence is uncomfortable for most monthly reports. With 100 responses per engine, a movement of a few points is noise. Some guides, such as TechnologyAdvice’s, suggest running each prompt three to five times; that is enough to see variance, not to measure a rate.
Because answers to the same prompt are correlated, grow the number of prompts before the number of repeats. Fifty prompts run eight times is fifty clustered observations, not 400 independent ones. Keep at least two runs per prompt per period so you can measure the noise floor, and compute intervals by resampling prompts rather than responses.
What has to be fixed before the first run
- The brand set: six to ten brands chosen from your competitive frame, with aliases written down.
- The prompt set: drawn from the questions buyers ask at each stage (category discovery, comparison, alternatives, use case, budget), with branded prompts held apart. The prompt matrix for checking ChatGPT and Perplexity is a good starting grid.
- Engines and location: each engine is its own population, and answers differ by country, so pin both.
- Scoring rules: what counts as a mention, how aliases resolve, whether a source card counts as a citation. Write them before scoring.
- Raw storage: keep every response’s text and cited URLs. Rates can be recomputed from raw responses; they cannot be recomputed from a dashboard.
A minimal log needs one row per response:
run_date,engine,location,prompt_id,prompt_type,repeat,brands_named,first_named,our_domain_cited,cited_urls,framing_code,response_pathWhat moves AI brand visibility
Start with an honest limit. Nobody outside the engine vendors knows the selection logic, and the public evidence is correlational. With that caveat stated, the correlations point in a consistent direction.
Across 75,000 brands, Ahrefs measured branded web mentions at 0.664, Domain Rating at 0.326 and backlinks at 0.218 against AI Overview visibility. These are Spearman coefficients Ahrefs themselves describe as moderate to very weak, and they warn against reading them causally.
A follow-up Ahrefs study published in December 2025 extended the analysis to ChatGPT and AI Mode. YouTube mentions, meaning a brand named in a video’s title, transcript or description, showed the strongest correlation with AI visibility (around 0.737) across all three surfaces. The same study found the three assistants largely mention the same brands, with correlations of 0.821 between AI Overviews and AI Mode and 0.749 between AI Overviews and ChatGPT. It is the same study design, so the same warning applies: these describe which brands are already visible, not what will make a brand visible.
Read together, the evidence supports five levers.
1. Be discussed where the engines read
Third-party mentions carry more weight in the data than anything on your own site. That means the unglamorous work: reviews on the sites your category relies on, inclusion in comparison and “best of” articles, expert commentary in trade press, and forum threads where people actually recommend you. Citation logs are the map. The third-party pages the engines already cite for your prompts are the ones to earn a place on.
2. Show up on YouTube
YouTube mentions topped the Ahrefs correlations on every surface. Videos that name your brand in the title, description or spoken transcript are the target, whether on your own channel or someone else’s. How engines read video, and what page structure helps, is covered in video schema, YouTube SEO and AI citations.
3. Make your own pages retrievable and quotable
Retrieval comes before selection. Google states that there are no additional requirements to appear in AI Overviews or AI Mode: a page must be indexed and eligible to be shown with a snippet, and normal SEO practice applies. For the other engines, check in your server logs that their crawlers actually reach your pages, which is what AI crawler log analysis does, and cover the Bing side with Bing Webmaster Tools for AI search.
Then make the pages that answer category questions easy to lift: a direct answer at the top, specific claims with sources, and pricing and product facts kept current. The free AEO Analyzer grades one URL against that checklist.
4. Fix what the engines get wrong about you
Branded prompts often surface outdated prices, retired products or a competitor’s positioning. Trace each error to the source the engine cited, correct it on your own site, and ask third parties to update theirs. This is the lever with the most direct cause and effect.
5. Stop spending on the weak correlates
The December 2025 Ahrefs study found very weak correlations between link metrics and AI mentions, and almost no relationship between the number of pages on a site and its AI visibility. Publishing more pages, or building links for volume, does not buy you mentions. For where these levers sit in a wider programme, the GEO audit checklist orders them.
Expect slow movement. Mentions accumulate over months, answers change as engines update, and citations decay unless the sources stay current, as described in how AI citations decay. Judge progress by quarters against your measured noise floor, not by weeks.
Tools: what to buy and what to ask
Collection at any useful scale needs a platform, and the platforms are compared, with verified pricing, in the AI visibility software guide. For one platform in depth, see the Peec AI review. If you want to run a manual pilot first, the prompt matrix linked above works with a spreadsheet.
Whatever you buy, ask these questions before signing, because they decide whether its numbers can go in a report:
- Can I export every raw response and its cited URLs, not just the scores?
- Can I fix my own brand set, or does the tool detect competitors each run?
- How many times is each prompt run per period, and can I see run-to-run variance?
- Are results reported per engine and per location?
- Where do the prompts come from, and can I edit them?
SparkToro’s advice is the right standard: before paying for AI tracking, make sure the provider shows its math.
What to report: a monthly template
A report has one job: to say what changed, whether the change is real, and what the team will do next. This structure fits on one page per engine.
| Section | Contents |
|---|---|
| 1. Sample | Engines, location, prompt count, runs per prompt, total responses, collection dates, any engine that failed to return answers |
| 2. Mention rate | Your rate with 95% interval, last period’s rate with interval, verdict: “up”, “down” or “no detectable change” |
| 3. Share of voice | Your share and each tracked competitor’s, with their mention rates alongside |
| 4. Citation share | Your rate, plus the ten most-cited third-party URLs for your prompts and whether you appear on them |
| 5. Framing and accuracy | Count of responses per framing code; list of factual errors found in branded prompts and their source pages |
| 6. Stability | Run-to-run agreement between repeats of the same prompt this period |
| 7. Downstream | AI referral sessions and conversions for the same period, and Search Console clicks for context |
| 8. Actions | What was done since the last report, and what happens next, each tied to a metric above |
Three rules make the template honest:
- The verdict comes from the intervals. If this month’s interval overlaps last month’s, the verdict is “no detectable change”, however the point estimates look.
- Report per engine. Pool only if the per-engine rows sit directly above the pooled row.
- Keep visibility and traffic in separate rows. Section 7 is context, not proof that section 2 worked. If you already build an SEO dashboard in Looker Studio, sections 2 and 7 can share a page, as long as they keep separate charts.
Refresh the prompt set once a quarter, and keep the old set running for one overlapping period so the series does not break. If you want this measurement set up, scored and reported as part of a GEO programme, that is the core of the GEO and technical SEO service.
Frequently asked questions
What is AI visibility?
AI visibility is how often, and how, AI answer engines name your brand, cite your pages and describe you when people ask about your category. It is measured by running a fixed set of prompts on each engine repeatedly and recording the answers. The core metrics are mention rate, citation share, share of voice and framing.
How do you measure AI brand visibility?
Fix a brand set, a prompt set, the engines and a location, then run every prompt at least twice per period and store the raw responses. Score each response for whether your brand is named, whether your domain is cited and how you are framed. Report each metric as a rate per engine with a 95% interval, so the reader can see what the sample supports.
How many times should I run each prompt?
At least twice per period, so you can measure run-to-run variance, but the number that matters is total responses per engine. About 100 responses gives an interval roughly 19 points wide at a 50% mention rate, and about 400 brings it to 10 points. Add prompts before adding repeats, because repeats of the same prompt are correlated.
Is ranking position in AI answers a useful metric?
No. SparkToro found less than a 1 in 100 chance of the same brand list appearing twice, and the same order was closer to 1 in 1,000. How often a brand appears across many runs is fairly stable, so report mention rate and, if you need an ordering signal, the share of responses where you are named first.
Can you improve AI brand visibility?
Yes, but slowly and without guarantees. The strongest correlates are off-site: brand mentions across the web and on YouTube, followed by branded anchors and branded search demand. On your own site, make sure pages are crawlable and indexed, answer category questions directly, and keep product facts accurate. Judge the result quarterly against your measured noise floor.
Does Google Search Console show AI visibility?
Only partly. Google includes AI Overviews and AI Mode in the Performance report under the Web search type, so clicks and impressions from those features are counted with everything else. It does not report whether an AI answer named your brand without linking to you, so brand visibility still has to be measured by sampling the answers.